top of page

Snow Cover Detection {Methodology Using Landsat}
NASA MODIS Land February 2004
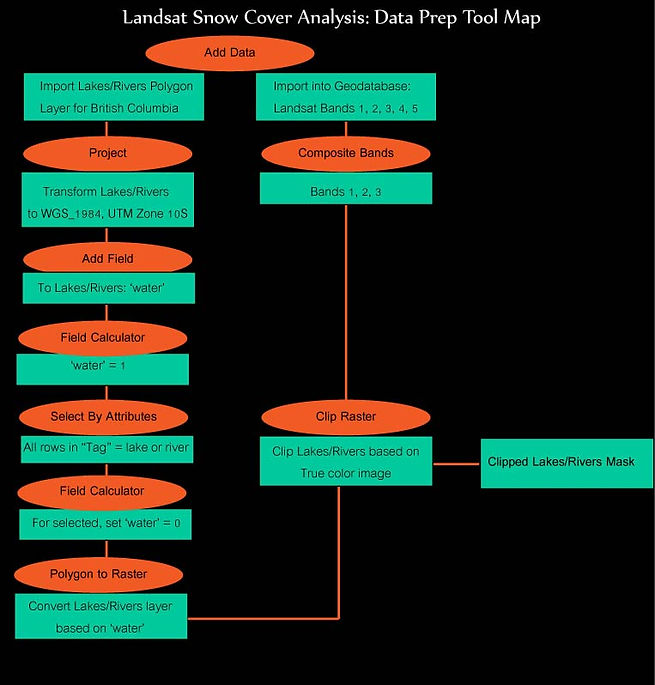
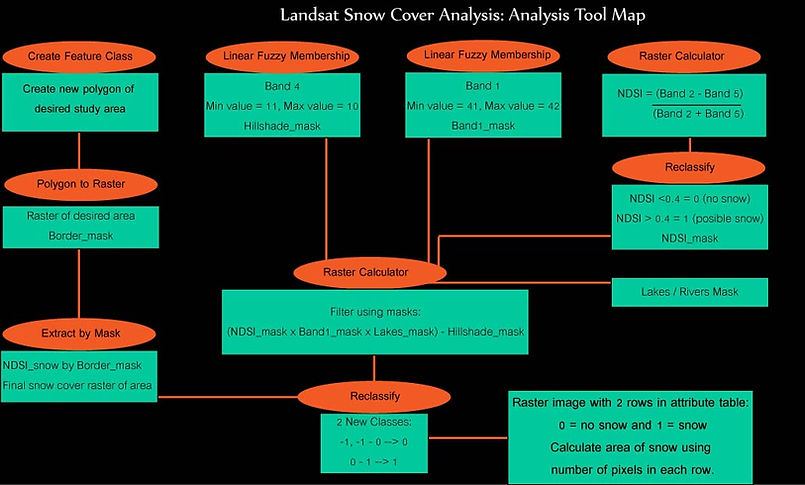
Tools used for the technical analysis of the Landsat band images include processes which transformed data between projections and from vector to raster data, classified raster images based on threshold values and created new raster images by applying calculations based on cell values. The following tool maps show what steps were taken and how the data was manipulated using each tool.
All tools are based in the Toolbox of the ArcMap software by ESRI.
Data Manipulation & Analysis Tool Map
bottom of page